Track These 7 Volleyball Statistics to Win More Games

Keeping statistics at every level of volleyball is essential. While stats don’t tell the whole story, they also don’t lie. In order to improve anything, you first must take a measure of it. Each statistic you track should have a purpose toward improving an aspect of your team’s performance.

Things to Remember

    • Keeping stats in volleyball is difficult because of the quick pace of the game. Keep it simple.
    • Experiment with tracking one or two of these statistics at practices before a match.
    • Share the data with your players. Work together to find patterns, strengthen your weaknesses, and improve together.
    • Use digital stat keepers if they work for you and your program.
NOTE: The coaching staff, team manager, or a parent should be responsible for taking the statistics
    • It is disrespectful to ask players to do it. They are players on the bench who should be cheering and ready to go in at any time.
    • If players are recording the stats for the players who are playing, it will create an environment of potential jealously and contempt

Attacking Efficiency

Record each players’ attack attempts, kills, and errors. Attacking percentage is the number of kills minus the number of errors, and then divided by total attacks. (Kills – Errors) /Total Attacks What to Look For: Find your best hitters and make sure they are getting set most often. Example:
statistics for attacking in volleyball
    • Chris’ attacking percentage = (4-1)/10 = .300%
    • Andrew’s attacking percentage = (7-3)/14 = .286%
    • Konst’s attacking percentage = (1-2)/7 = -.146%

Serve Receive Passing

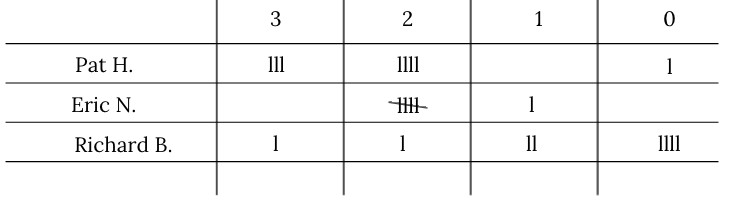
Another classic volleyball stat – each player’s serve receive pass is rated as a 0, 1, 2, or 3.

    • 0 – player got aced or the pass was so bad there was no second contact
    • 1 – bad pass; setter only has one hitting option
    • 2 – okay/good pass; setter only has two hitting options
    • 3 – perfect pass

Passing percentage is the sum of their passes score divided by number of passes.

(amount of 3 Passes x 3) + (amount of 2 Passes x2) + (amount of 1 Passes) / Total Passes

What to Look For: Find your best serve receivers and make sure they are passing the ball most often.

Example:

volleyball statistics for serve receive
    • Pat’s pass rating = (9+8)/8 = 2.1
    • Eric’s pass rating = (10+1)/6 = 1.8
    • Richard’s pass rating = (3+2+2)/8 = 0.9

Serve Receive Rotations

Track how long it takes to get out of each serve receive rotation.

Volleyball is a serve and serve receive game. Siding out as soon as possible is critical to winning.

How to Use Results:

    • Find your weakest rotations and practice first-ball-side-out drills.
    • Consider a starting lineup that is furthest away from your weakest serve receive rotation.

Example:

checkmarks and x next to people's names in a grid

Serving Percentage

Track each players’ made serves, aces, and errors.

Very useful for young teams, where serving is an important winning factor.

How to Use Results:

    • Useful as a visual to show the players how effective their serves are.
    • Find your best servers and make sure they serve early in the game.

Example:

checkmarks and x's next to people's names in a grid

Reverse Serving Percentage

Measure the quality of each serve based on the result of the opponent’s pass.

At higher levels, the focus of the serve is to get opponent out-of-system. Not just about serving in, but about getting a good result.

    • 0 – service error
    • 1 – opponent gives a perfect pass
    • 2 – opponent gives a good pass (setter has two hitting options)
    • 3 – opponent gives a poor pass (setter only has one hitting option)
    • 4 – service ace or opponent overpasses

How to Use Results: Find your best servers and make sure they serve early in the game. They want to be mindful about

Example:

roman numerals next to a person's name
    • Emily’s serve rating = (12+15+4)/10 = 3.1
    • Nikki’s serve rating = (8+1)/5 = 1.8
    • Maggie’s serve rating = (2)/3 = 0.7

Visualizing Team Offense

While this tracking isn’t by numbers, it is a great visual. Using this format, you can see:

    • Where your team is attacking from
    • Where they are hitting to
    • Where they are getting kills

How to Use Results: Share with your team and attack the areas you are already getting kills in.

Example:

one side of a volleyball court with arrows and x's

Visualizing Team Defense

The inverse of the last statistic, visually track:

    • Where your opponents are attacking from
    • Where they are hitting to
    • Where they are getting kills

How to Use Results: Share with your team and adjust to the areas they are getting kills in.

Example:

one side of a volleyball court with arrows and x's

Download 7 Free Volleyball Stats Templates

Start using our simplified statistics tracking sheets, each with a purpose toward improving an aspect of your team’s performance.